Dog Nutrition Tracker
A user-centric dog food tracking app
- Type
- UX Design
- Time
- 2025.09 - 2025.12
- Tool
- Figma
contents
Overview
This project focuses on the lack of systematic management and nutritional insights in daily dog feeding. Most existing apps primarily support simple logging, while overlooking treat calories, portion accuracy, and coordination among multiple caregivers, which can easily lead to duplicate feeding and nutritional imbalance. To address the needs of multi-caregiver households, high-frequency trainers, and owners who feel uncertain about portion control, this project proposes a mobile app concept centered on visualizing nutritional progress and synchronizing feeding records across caregivers. Through a consistent and simple logging system, clear data feedback, and goal-setting support, the design reduces user burden and helps owners manage their dogs’ diets in a more scientific, sustainable, and collaborative way.
Study and Research
Secondary Research
Through an analysis of existing pet feeding apps and relevant academic research, we found that most products only support basic event logging and lack key features such as portion guidance, visual representation of treat calories, and multi-caregiver collaboration mechanisms. Additionally, research indicates that treats are often given frequently as emotional rewards, making them the most easily overlooked source of “hidden calories.” This further exacerbates the uncertainty of feeding management and poses long-term health risks.
Primary Research
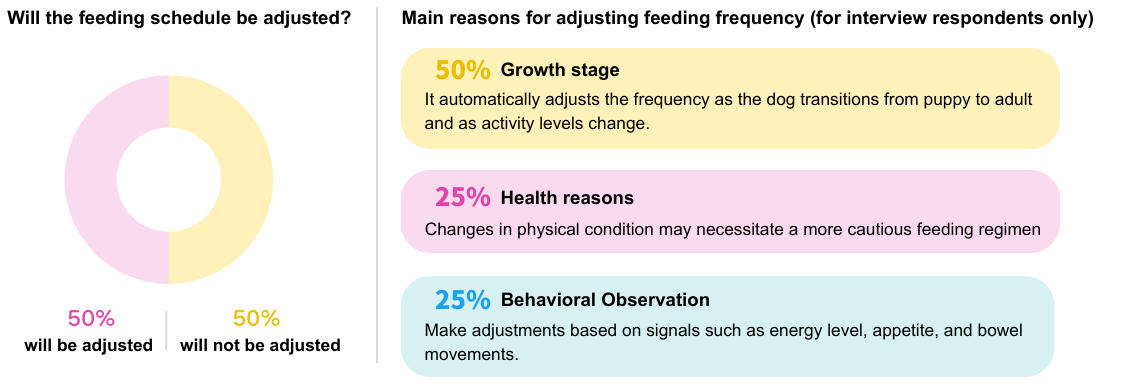
Through interviews with dog owners, we identified several distinct behavioral patterns:
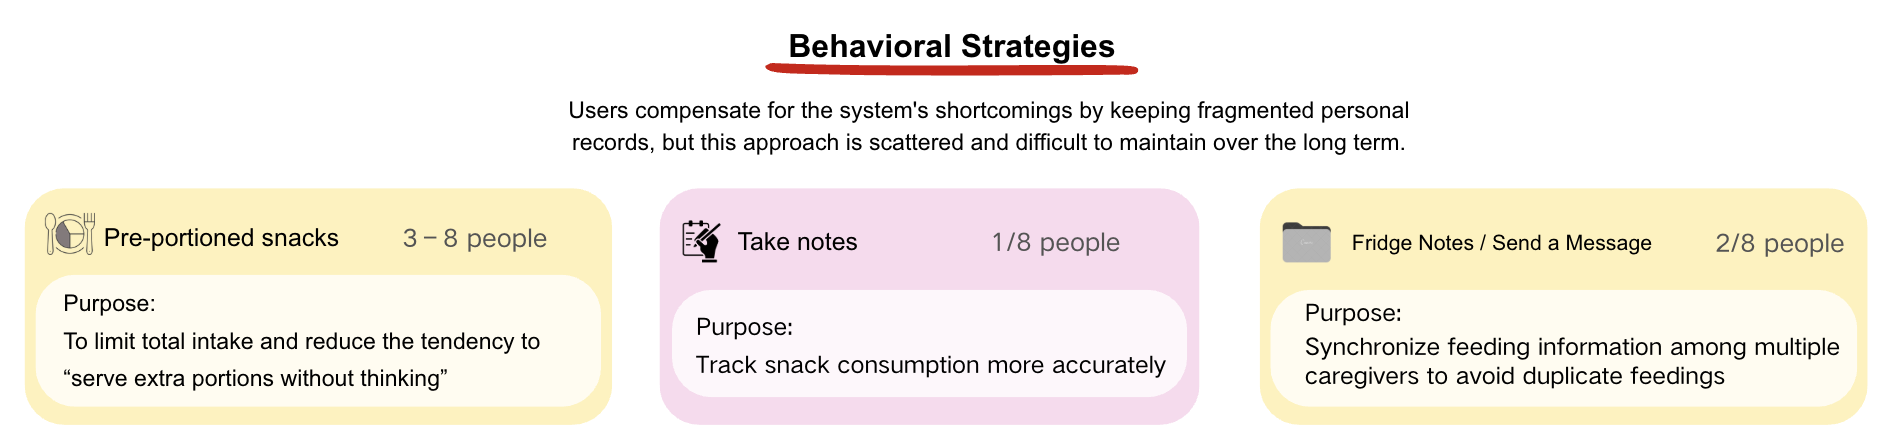
- Snack intake is often not recorded;
- Feeding decisions are based more on intuition than on structured management;
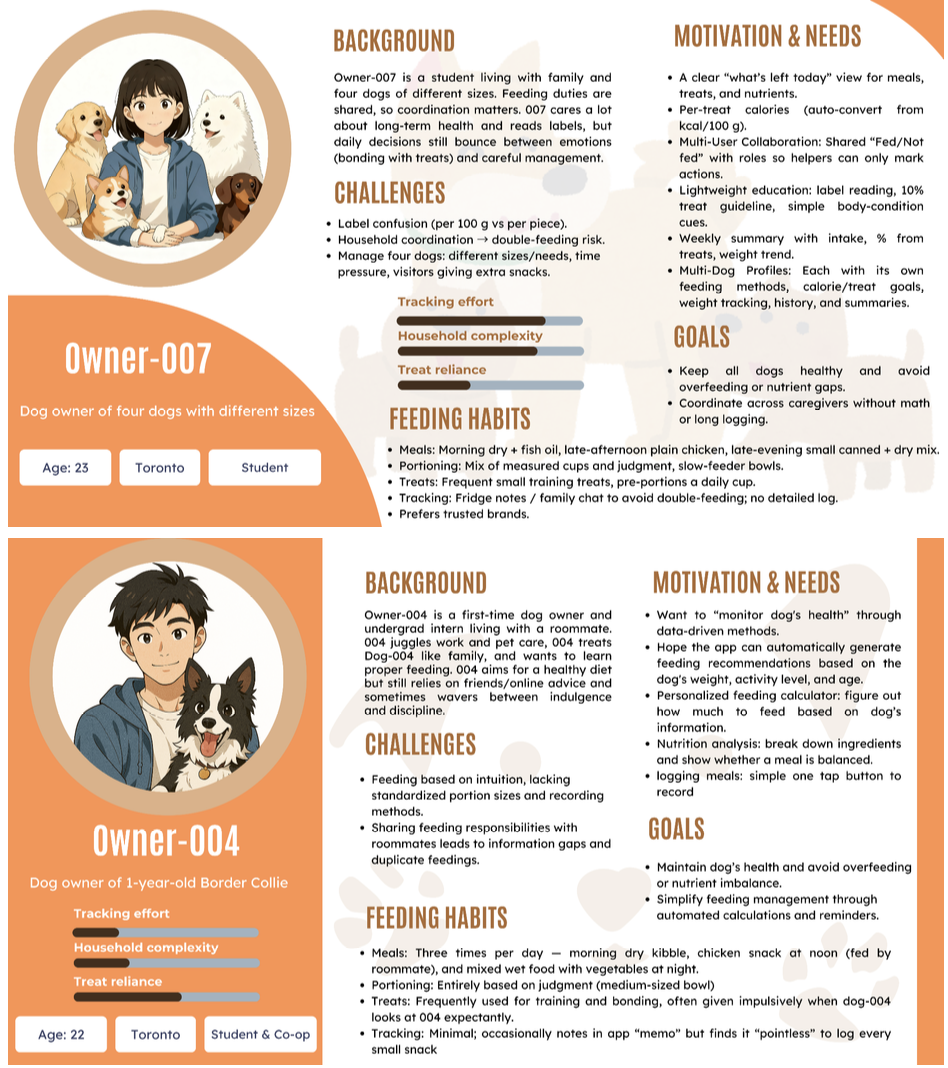
- Multiple caregivers often lead to double-feeding;
- Many first-time owners lack a clear understanding of appropriate portion sizes.
Persona
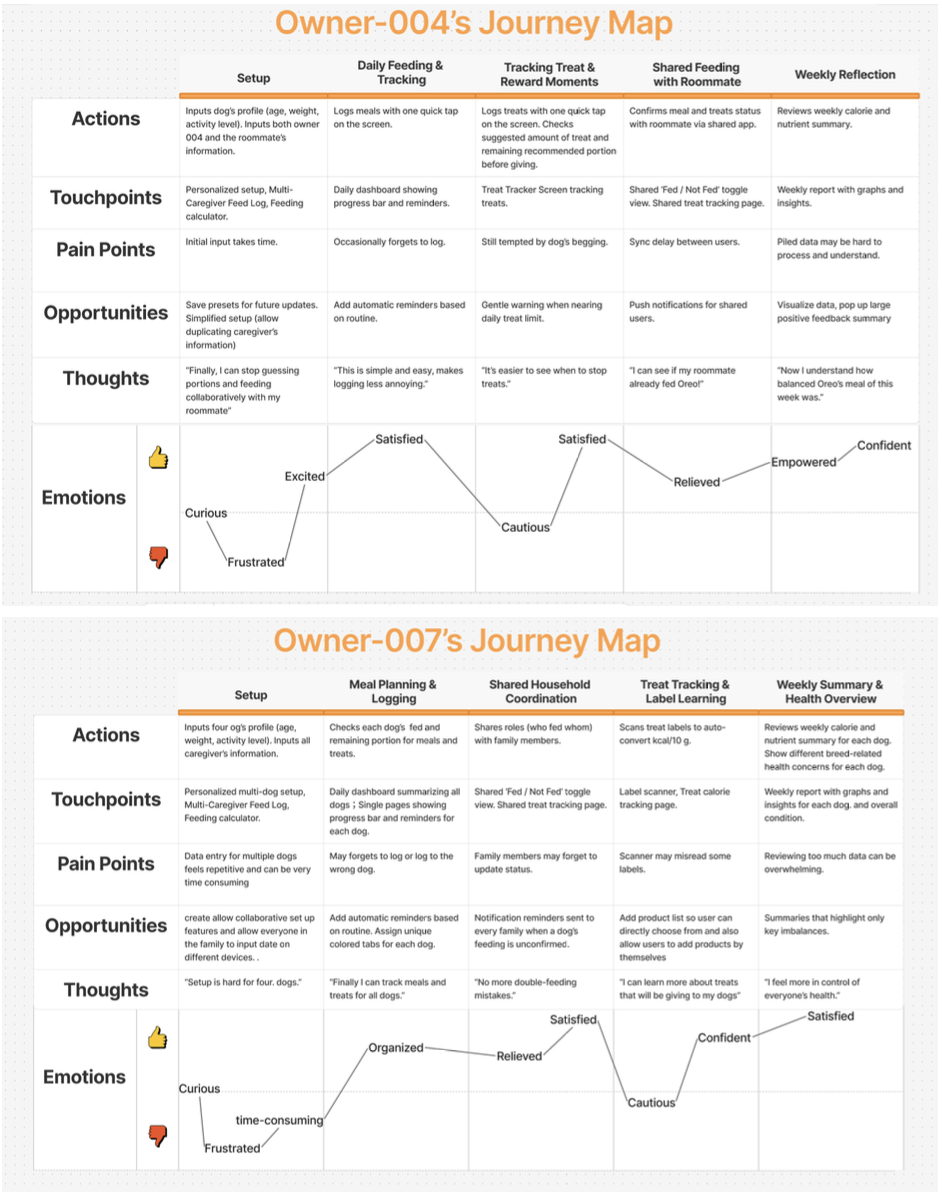
User Journey Map
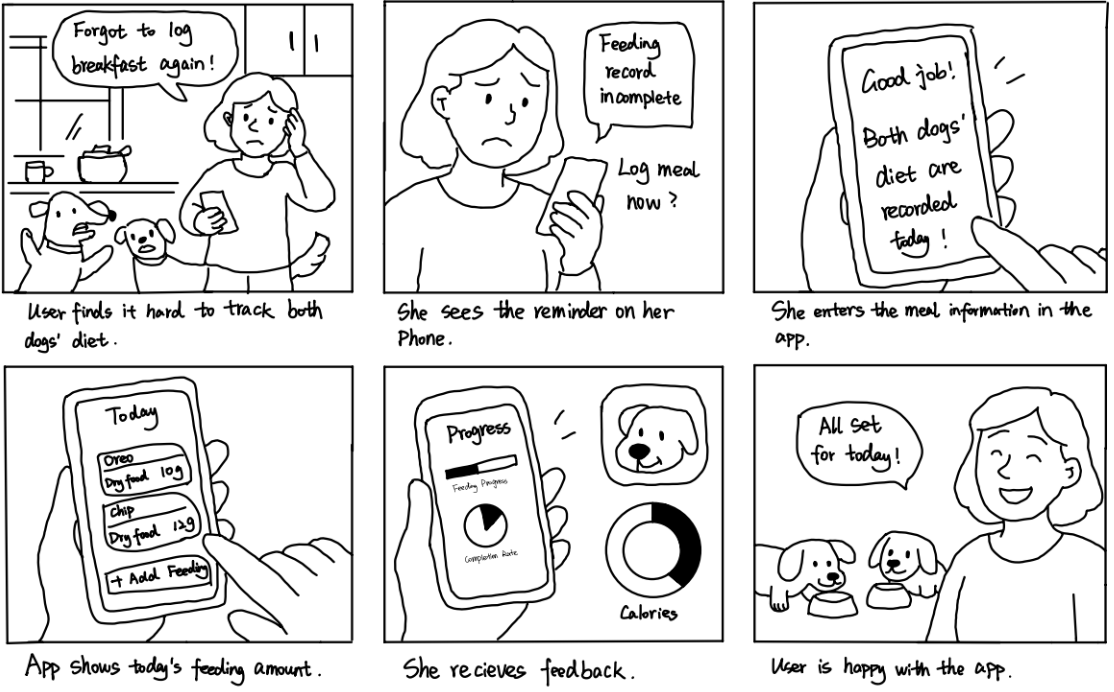
Story Board
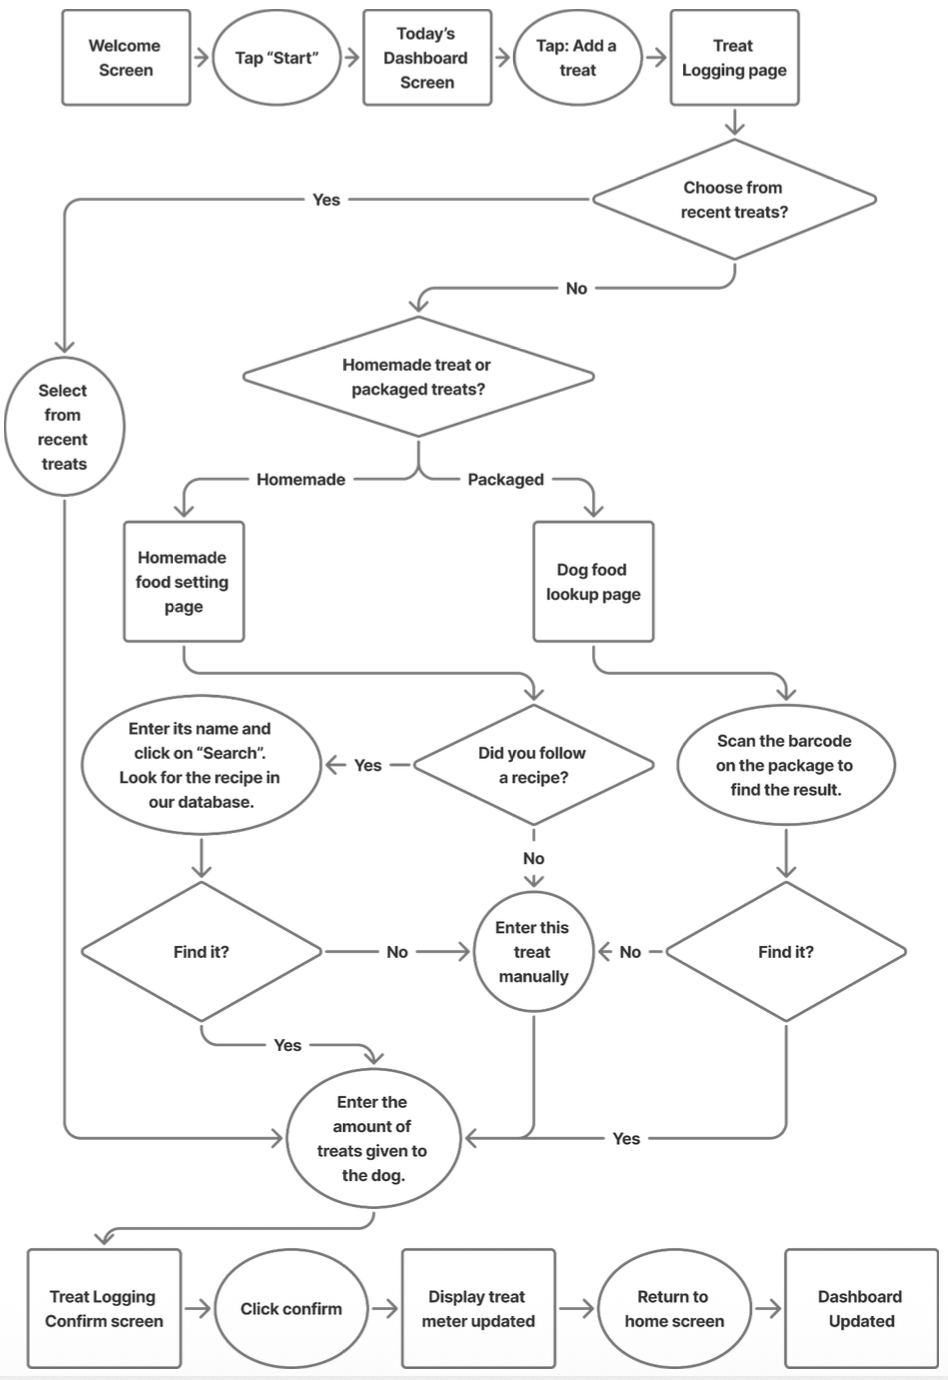
User Task-Flow Diagram
Initial Wireframes
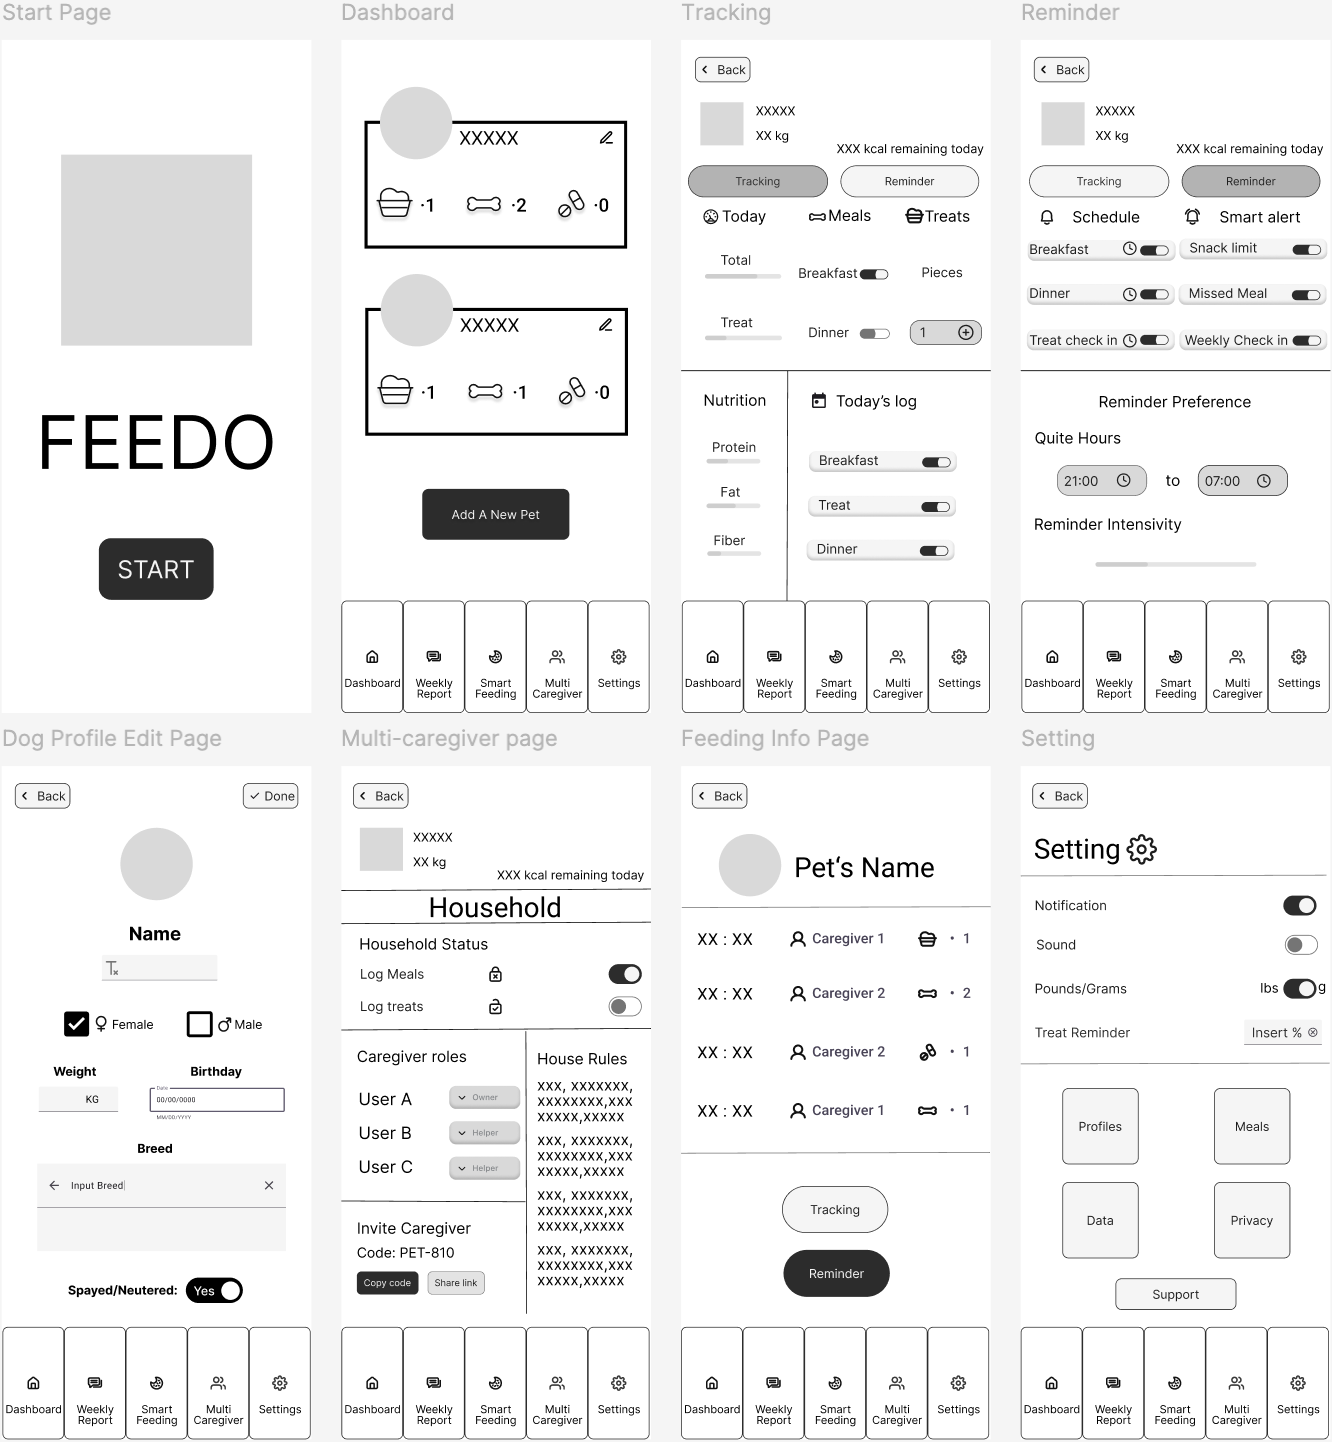
Before moving into high-fidelity visual design, we first used low-fidelity wireframes to organize the overall information architecture and core interaction logic. This stage focused on validating page layout, information hierarchy, and key user flows. It allowed us to quickly iterate on different structural approaches at a low cost and clarify what users need to see first and what actions they should prioritize on each screen.
The initial wireframes were built around key usage scenarios, including:
- A unified dashboard that provides an at-a-glance overview of each pet’s daily status;
- Quick-access logging for meals and treats;
- A multi-caregiver coordination page designed to prevent duplicate feeding;
- Tracking and reminder modules that display daily intake progress and feeding schedules;
- Simple profile and settings pages that allow easy access to core functions.
The overall design emphasized clarity, intuitiveness, and low cognitive load.
Interactive Prototype Design and Usability Testing
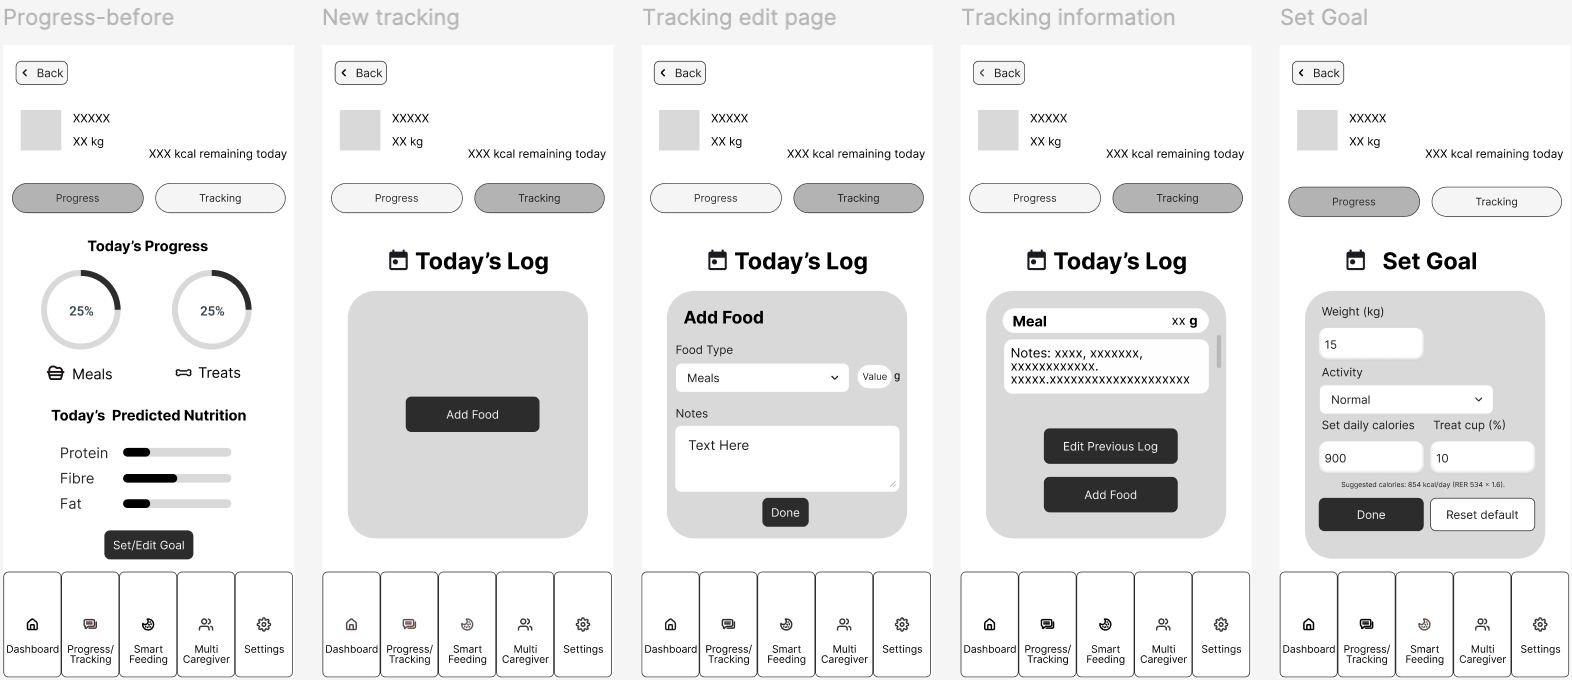
After completing the wireframes, we transformed them into an interactive prototype to simulate the full end-to-end user experience. The prototype included key workflows such as switching between pets on the dashboard, logging meals and treats, checking daily nutrition progress, setting reminders, and coordinating feeding among multiple caregivers. Building the prototype allowed us to evaluate how well these functions worked together and ensured that the system provided a coherent and consistent experience in realistic usage scenarios.
Our first round of usability testing took place in class. Participants were asked to complete core tasks such as logging a meal and checking progress. Although the prototype was functionally usable, users showed clear confusion in several areas:
- The button structure on the Tracking page was unclear. Participants were unsure where to begin and how to use the logging features.
- The progress bar on the right side of the page lacked clear explanation, making it difficult for users to understand what the data represented.
- Some participants asked how to set a feeding goal, which revealed that the system did not yet include a dedicated interface for goal setting.
Based on this feedback, we simplified and reorganized several core screens:
- Redesigned the Tracking page to make the primary actions clearer;
- Improved the Progress view to make nutritional data easier to interpret;
- Added a dedicated Set Goal page to clarify the goal-setting process;
- Removed the Reminder feature to reduce system complexity and cognitive load.
After these changes, the discoverability of key features improved significantly, and the overall user flow became more intuitive and natural.
Second Round of Usability Testing
In the second round of testing, we invited dog owners outside the class and conducted remote usability sessions via Microsoft Teams. Participants were asked to complete two core tasks: logging a feeding entry and checking the updated progress indicators.
This round of testing revealed several new insights. First, many users had difficulty locating the Tracking feature and often spent a significant amount of time searching for where to log a meal. Several participants suggested adding a more prominent logging button on the Dashboard to make the entry point easier to find. Second, some users did not clearly realize that their log had been successfully submitted, which led them to enter the same information multiple times. This indicated that the system’s feedback mechanism needed to be strengthened. On a positive note, most participants were able to clearly recognize the changes in the progress indicators, suggesting that the improvements made to the progress visualization in the previous iteration were effective.
The second round of testing further highlighted key issues related to feature discoverability and action feedback, and clarified the priorities for subsequent design improvements. Based on these insights, I continued refining and restructuring the interface during the individual stage of the project.
Final Wireframe Design
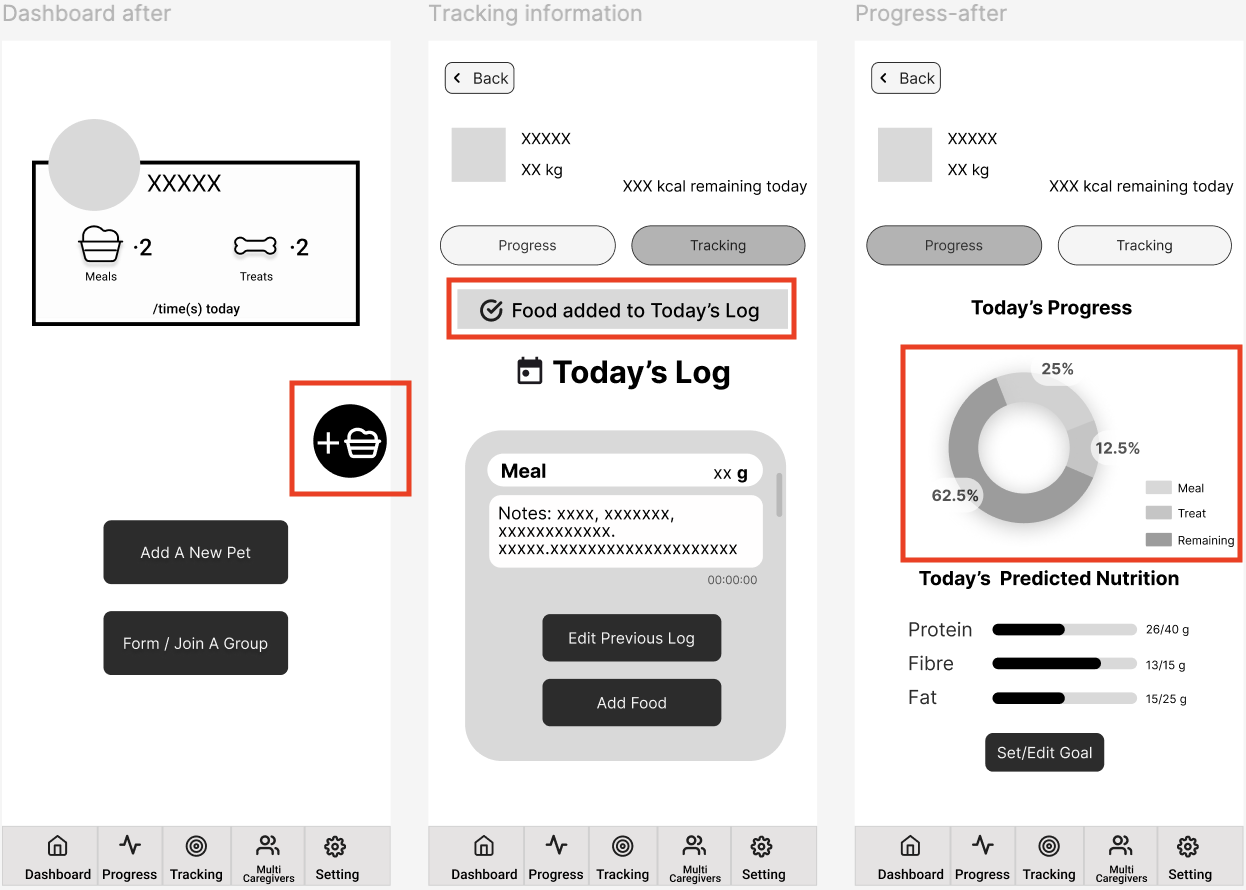
The final interface integrates key insights from the second round of user testing and focuses on improving the discoverability, clarity, and efficiency of core actions. To address the navigation and feedback issues identified during testing, several refinements were implemented:
- A prominent Tracking shortcut was added to the Dashboard, allowing users to quickly locate the logging function and directly addressing one of the most common points of confusion identified in testing.
- A Success Toast notification now appears at the top of the screen after a log is submitted, clearly confirming that the entry has been recorded and preventing duplicate logging.
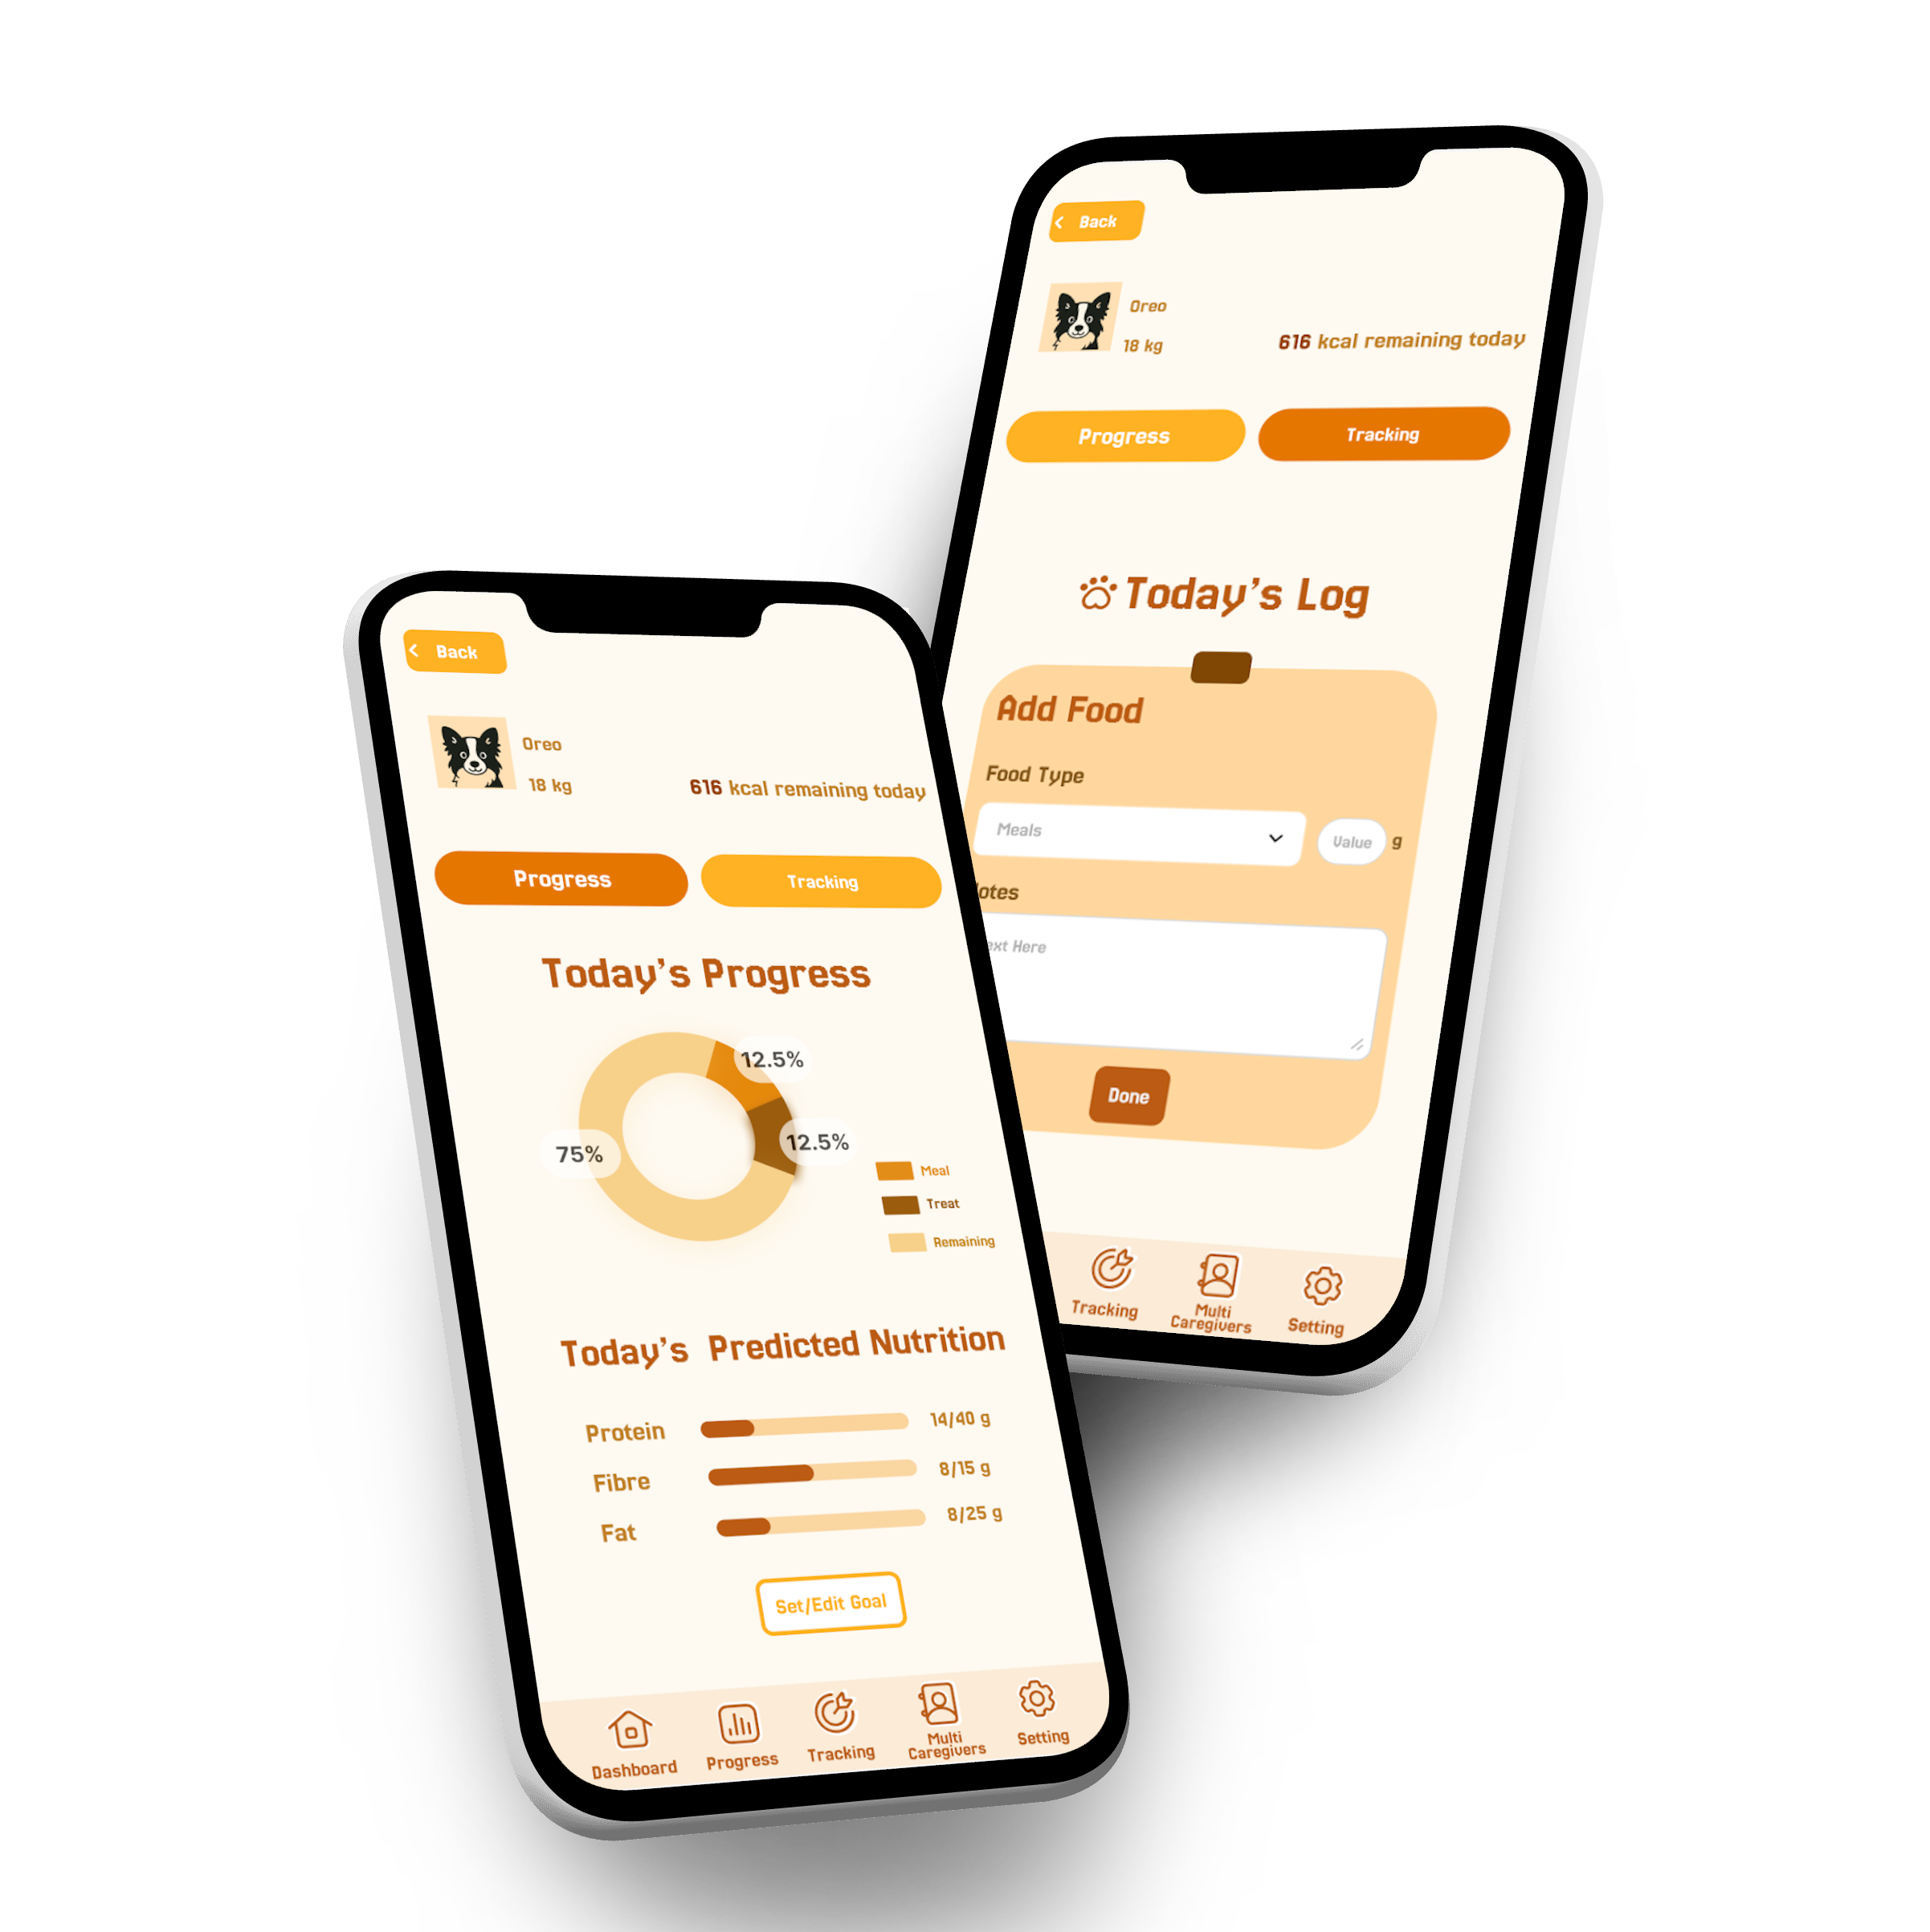
- The original two circular progress indicators were redesigned as donut charts, enabling users to quickly understand the proportion of meals and treats consumed each day and improving the clarity of data visualization.
Final UI Design
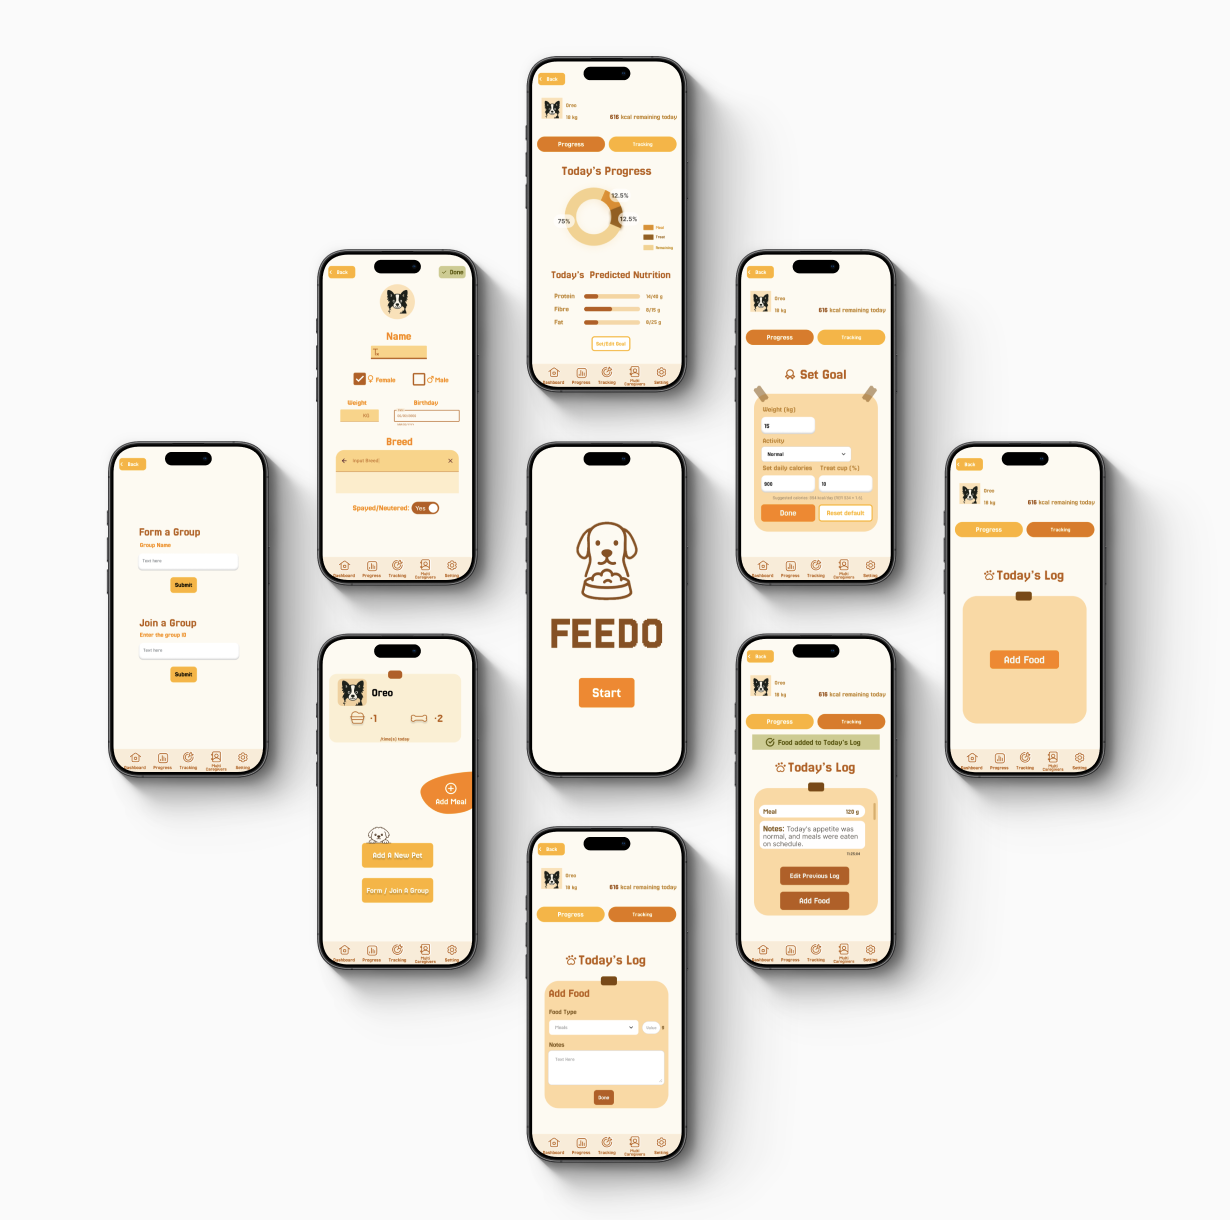
The final outcome is an application design grounded in user research and refined through multiple rounds of iteration. The design streamlines the daily feeding logging process, makes nutritional progress easier to understand, and provides a smoother and clearer recording experience. The system also supports collaboration among multiple caregivers, helping prevent common issues such as duplicate feeding. From the Dashboard’s quick logging shortcut, to the donut-chart progress visualization, and the clear success feedback after each entry, every key feature was shaped through ongoing usability testing and validated by real user needs. Together, these design decisions resulted in a feeding management tool that is clear, intuitive, and trustworthy, offering dog owners more reliable and sustainable support for daily feeding routines.